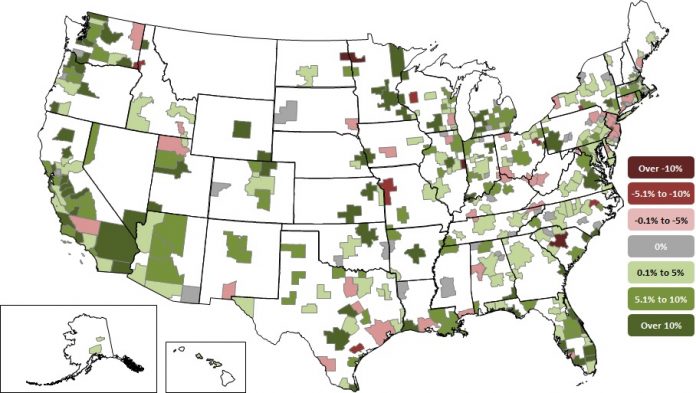
It was a generally good year for California construction employment in 2017, with all but two of about 33 metropolitan areas reporting job growth.
In fact, Riverside-San Bernardino-Ontario added the most construction jobs nation-wide in the past year, representing a 15 per cent increase or 14,300 jobs, in US Bureau of Labor statistics data reported by the Associated General Contractors of America (AGCA).
Statewide, construction (and mining and logging jobs calculated in the total in smaller areas) increased by between 7 and 8 percent, with almost 120,000 new jobs added — for a total employment in the industry greater than 1.65 million.
Here is a table showing the California numbers by market area. In smaller areas, the BLS lumps construction with mining and logging — but in most areas where the data is broken down by sectors, the great majority of workers are in the construction industry.
| Area | Industry | Dec. ‘16 | Dec. ‘17 | 12 mo. % change | 12 mo. Gain/loss | rank |
|---|---|---|---|---|---|---|
| Statewide | Construction | 774200 | 834200 | 8% | 60000 | |
| Statewide | Const, mining,logging | 797300 | 856500 | 7% | 59200 | |
| Anaheim-Santa Ana-Irvine | Construction | 96900 | 104300 | 8% | 7400 | 85 |
| Bakersfield | Construction | 14400 | 14300 | -1% | -100 | 316 |
| Chico | Const., mining, logging | 3500 | 4100 | 17% | 600 | 6 |
| El Centro | Const, mining,logging | 1800 | 2000 | 11% | 200 | 33 |
| Fresno | Construction | 15700 | 17000 | 8% | 1300 | 85 |
| Hanford-Corcoran | Const., mining,logging | 900 | 1000 | 11% | 100 | 33 |
| Los Angeles-Long Beach-Glendale | Construction | 132000 | 138300 | 5% | 6300 | 156 |
| Madera, CA | Const, mining,logging | 1900 | 2200 | 16% | 300 | 7 |
| Merced | Const, mining,logging | 2200 | 2500 | 14% | 300 | 16 |
| Modesto | Const, mining,logging | 8800 | 10100 | 15% | 1300 | 11 |
| Napa | Const, mining,logging | 3800 | 4300 | 13% | 500 | 20 |
| Oakland-Hayward-Berkeley | Construction | 68100 | 73600 | 8% | 5500 | 85 |
| Oxnard-Thousand Oaks-Ventura | Construction | 14700 | 16100 | 10% | 1400 | 46 |
| Redding | Const, mining,logging | 3100 | 3500 | 13% | 400 | 20 |
| Riverside-San Bernardino-Ontario | Construction | 94600 | 108900 | 15% | 14300 | 11 |
| Sacramento—Roseville--Arden-Arcade | Construction | 53000 | 55800 | 5% | 2800 | 156 |
| Salinas | Construction | 5900 | 6200 | 5% | 300 | 156 |
| San Diego-Carlsbad | Construction | 76700 | 80000 | 4% | 3300 | 187 |
| San Francisco-Redwood City-South San Francisco | Construction | 39300 | 43400 | 10% | 4100 | 46 |
| San Jose-Sunnyvale-Santa Clara | Construction | 49300 | 50100 | 2% | 800 | 250 |
| San Luis Obispo-Paso Robles-Arroyo Grande | Const, mining,logging | 7300 | 800 | 10% | 700 | 46 |
| San Rafael | Construction | 6800 | 7200 | 6% | 400 | 130 |
| Santa Cruz-Watsonville | Const, mining,logging | 4600 | 5000 | 9% | 400 | 70 |
| Santa Maria-Santa Barbara | Construction | 8500 | 9000 | 6% | 500 | 130 |
| Santa Rosa | Construction | 12500 | 13500 | 8% | 1000 | 85 |
| 'Stockton-Lodi | Construction | 11200 | 12400 | 11% | 1200 | 33 |
| Vallejo-Fairfield | Construction | 10500 | 10500 | 0% | 0 | 278 |
| Visalia-Porterville | Const, mining,logging | 5500 | 6000 | 9% | 500 | 70 |
| Yuba City | Const, mining,logging | 2300 | 2400 | 4% | 100 | 187 |
Nation-wide construction employment increased in 269 out of 358 metro areas between December 2016 and December 2017, declined in 43 and stagnated in 46, the AGCA reported. Association officials said new infrastructure funding would help ensure firms continue to expand their headcount in 2018.


