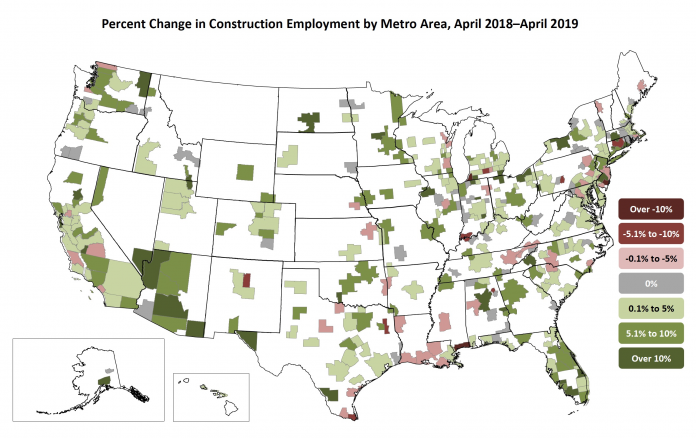
Some areas of California boomed in terms of construction employment in the past year, but others experienced a bust, according to US Labor department data reported by the Associated General Contractors of America (AGCA).
As a example, the northern California community of Chico had the sixth largest growth by percentage in the nation (though smaller markets such as Chico also include mining and logging in the totals). Employment there grew by 600 or 14 percent from 4,200 to 4,800.
On the other side of the spectrum, San Luis Obispo-Paso Robles-Arroyo Grande recorded a 4 percent decline, or 300 employees, from 7,700 workers employed to 7,400 — making it the 333th ranking market area in the nation.
In major centers, Los Angeles-Long Beach-Glendale reported a six per cent increase (ranking 84th in the nation) or 8,400 jobs, increasing employment from 144,100 to 152,500.
San Francisco-Redwood City-South San Francisco saw a 4,000 employee increase, and a 25th place national ranking, with construction employment growing 10 percent fro 4,160 to 4,560.
Data for other California markets is below:
Listings include in order the community name, the number of jobs in April 2018, April 2019 employment, the percentage increase (decrease), net change in employment, and national ranking.
- Hanford-Corcoran, CA Mining, Logging, and Construction 1,000 1,100 10% 100 25
- Santa Rosa, CA Construction 14,400 15,500 8% 1,100 46
- Yuba City, CA Mining, Logging, and Construction 2,400 2,600 8% 200 46
- Los Angeles-Long Beach-Glendale, CA Div. Construction 144,100 152,500 6% 8,400 84
- Madera, CA Mining, Logging, and Construction 1,800 1,900 6% 100 84
- Redding, CA Mining, Logging, and Construction 3,100 3,300 6% 200 84
- Fresno, CA Construction 18,300 19,200 5% 900 124 Oxnard-Thousand Oaks-Ventura, CA Construction 16,800 17,700 5%
- 900 124 Sacramento–Roseville–Arden-Arcade, CA Construction 61,200 64,100 5% 2,900 124
- Napa, CA Mining, Logging, and Construction 4,700 4,900 4% 200 148
- Oakland-Hayward-Berkeley, CA Div. Construction 74,500 77,300 4% 2,800 148
- San Rafael, CA Div. Construction 7,600 7,900 4% 300 148 Stockton-Lodi, CA Construction 12,500 13,000 4% 500 148
- Modesto, CA Mining, Logging, and Construction 9,900 10,200 3% 300 169
- Riverside-San Bernardino-Ontario, CA Construction 103,600 105,700 2% 2,100 199
- Salinas, CA Construction 6,500 6,600 2% 100 199
- Santa Cruz-Watsonville, CA Mining, Logging, and Construction 4,400 4,500 2% 100 199
- San Diego-Carlsbad, CA Construction 83,800 84,300 1% 500 225
- San Jose-Sunnyvale-Santa Clara, CA Construction 49,300 49,700 1% 400 2250% 0 251
- Anaheim-Santa Ana-Irvine, CA Div. Construction 105,300 104,200 -1% -1,100 306
- Vallejo-Fairfield, CA Construction 11,000 10,900 -1% -100 306
- Visalia-Porterville, CA Mining, Logging, and Construction 6,000 5,900 -2% -100 315
Nationally, construction employment grew in 250 out of 358 metro areas between April 2018 and April 2019, declined in 53 and was unchanged in 55, AGCA officials said, adding that construction employment in many parts of the country likely would have been higher if firms could find more qualified workers to hire.
“Demand for construction is steady or rising in most parts of the country, and many contractors are adding workers when they can find them,” said Ken Simonson, the association’s chief economist. “At the same time, many firms report they would have hired even more employees if only they could find enough qualified workers.”
The Phoenix-Mesa-Scottsdale, Ariz. metro area added the most construction jobs during the past year (16,600 jobs, 14 percent). Other metro areas adding a large amount of construction jobs during the past 12 months include Dallas-Plano-Irving, Texas (9,200 jobs, 6 percent); Atlanta-Sandy Springs-Roswell, Ga. (7,000 jobs, 6 percent) and Las Vegas-Henderson-Paradise, Nev. (6,800 jobs, 11 percent). The largest percentage gain occurred in Monroe, Mich. (26 percent, 500 jobs) and St. Cloud, Minn. (26 percent, 1,500 jobs), followed by Auburn-Opelika, Ala. (25 percent, 600 jobs) and Norwich-New London-Westerly, Conn.-R.I. (16 percent, 600 jobs).
The largest job losses between April 2018 and April 2019 occurred in Charlotte-Concord-Gastonia, N.C.-S.C. (-2,600 jobs, -4 percent), followed by Baton Rouge, La. (-1,800 jobs, -3 percent); Hartford-West Hartford-East Hartford, Conn. (-1,600 jobs, -8 percent) and Longview, Texas (-1,300 jobs, -9 percent). The largest percentage decrease took place in Gulfport-Biloxi-Pascagoula, Miss. (-13 percent, -1,200 jobs) and Atlantic City-Hammonton, N.J. (-13 percent, -800 jobs), followed by Niles-Benton Harbor, Mich. (-12 percent, -300 jobs); Evansville, Ind.-Ky. (-9 percent, -1,000 jobs) and Longview, Texas.
Association officials said that even though construction employment continues to expand in many parts of the country, workforce shortages remain problematic for many contractors eager to keep pace with strong demand. They urged federal officials to boost investments in career and technical education and to enact immigration reform that allows more men and women with construction skills to legally enter the country. They also urged state and local education officials to establish more school programs that offer exposure to essential construction skills.
“One reason relatively few young adults choose to pursue rewarding careers in construction is because not many of them are being told it is an option to consider,” said Stephen E. Sandherr, the association’s chief executive officer. “We have a lot of contractors looking for workers so they can keep up with the amount of work that is out there.”


